Babel

Digitalizing the Events Industry with Artificial Intelligence, Machine Learning & ISDA AI

Digitalizing The Events Industry With Artificial Intelligence, Machine Learning & ISDA AI

The events industry has seen a major overhaul since the onset of COVID-19! With global lockdowns alongside a major push for Safe Events, the industry has adapted to Virtual & Hybrid events.

Babel’s Hyper-Personalized Engagement platform (ISDA AI) which was deployed at the SWITCH 2020 event was well received & appreciated. With this positive shot in the arm – our aim now is to empower the global Events Industry with the power of Data and Analytics. This spurred the inquisitive Data team at Babel to refine & release an Event Analytics package. The package was released in conjunction with IMDA Singapore, Global Sign.In, SACEOS & Babel as part of the IMDA OIP Challenge.

Exhibitors-and-Event-Organizers

This package is focused on helping Exhibitors and Event Organizers identify, understand & engage with the relevant audience. We have subsequently open-sourced a few key components for the Events Industry.

This involved the following Advanced Analytics modules from our ISDA AI platform:

1. Customer segmentation

2. Analysis & Understanding the audience engagement behaviours The open-sourced code is available for public usage on Babel’s Github.


Now, let us dive deeper into the underlying benefits this ISDA AI module brings to the Event industry!

Audience-Segments

There are 2 key Business Objectives that this package aims to help with:

1. Understanding the Audience Segments that each Attendee is suitable for. Based on advanced Segmentation approaches like Recency Frequency Monetary value (RFM).

2. Identifying correlations amongst the data generated at the event.

Events, by nature, are ephemeral & fleeting marketing activities. They help boost Brand visibility & drive greater lead generation. As a result, it becomes even more critical to understand:

1.Event Funnel Performance (i.e. people enrolled v/s attendees visiting v/s qualified leads)  
 

2.What differentiates one group from the other   
 

3.Various dimensions of engagements (content consumed, channel engaged, questions asked, etc.)   
 

4.The impact of underlying attendee demographics, behaviours, signals at different types of events   

Correlations are our tool of choice to better understand the impact created by each data point.  


Correlation is the statistical measure indicating the strength of a linear relationship between two numerical variables. Example, Number of attendees from Fortune 500 companies & Number of Demo requests. Correlation values range from +1 (positive) to -1 (negative).  

A positive correlation is one where both variables move in the same direction. When one variable increases the other also increases and vice-versa. A negative correlation is a relationship where one variable increases as the other decreases.  An example could be that the more attendees you meet, the more Qualified leads you to generate. 

There are several kinds of correlations that may be worked out on a given set of parameters. Some different correlation coefficients include:   

1.Pearson’s   

2.Kendall’s, and   

3.Cramer’s  


Each correlation coefficient has its own significance. Babel has chosen Pearson’s correlation – as the default correlation parameter.  


Further, the package accounts for non-Data Scientists using the package. Thus, issues like missing and/or anomalous values are tackled by ISDA AI itself – one of the salient features!  
 

The outcomes of the correlation module are:  


1.Number of columns used & unused for the Correlation module. Certain columns are not considered due to problems viz. missing data, columns with maximum identical values, etc. 

2.An Excel file containing a table indicating the correlation of each pair of columns used. 

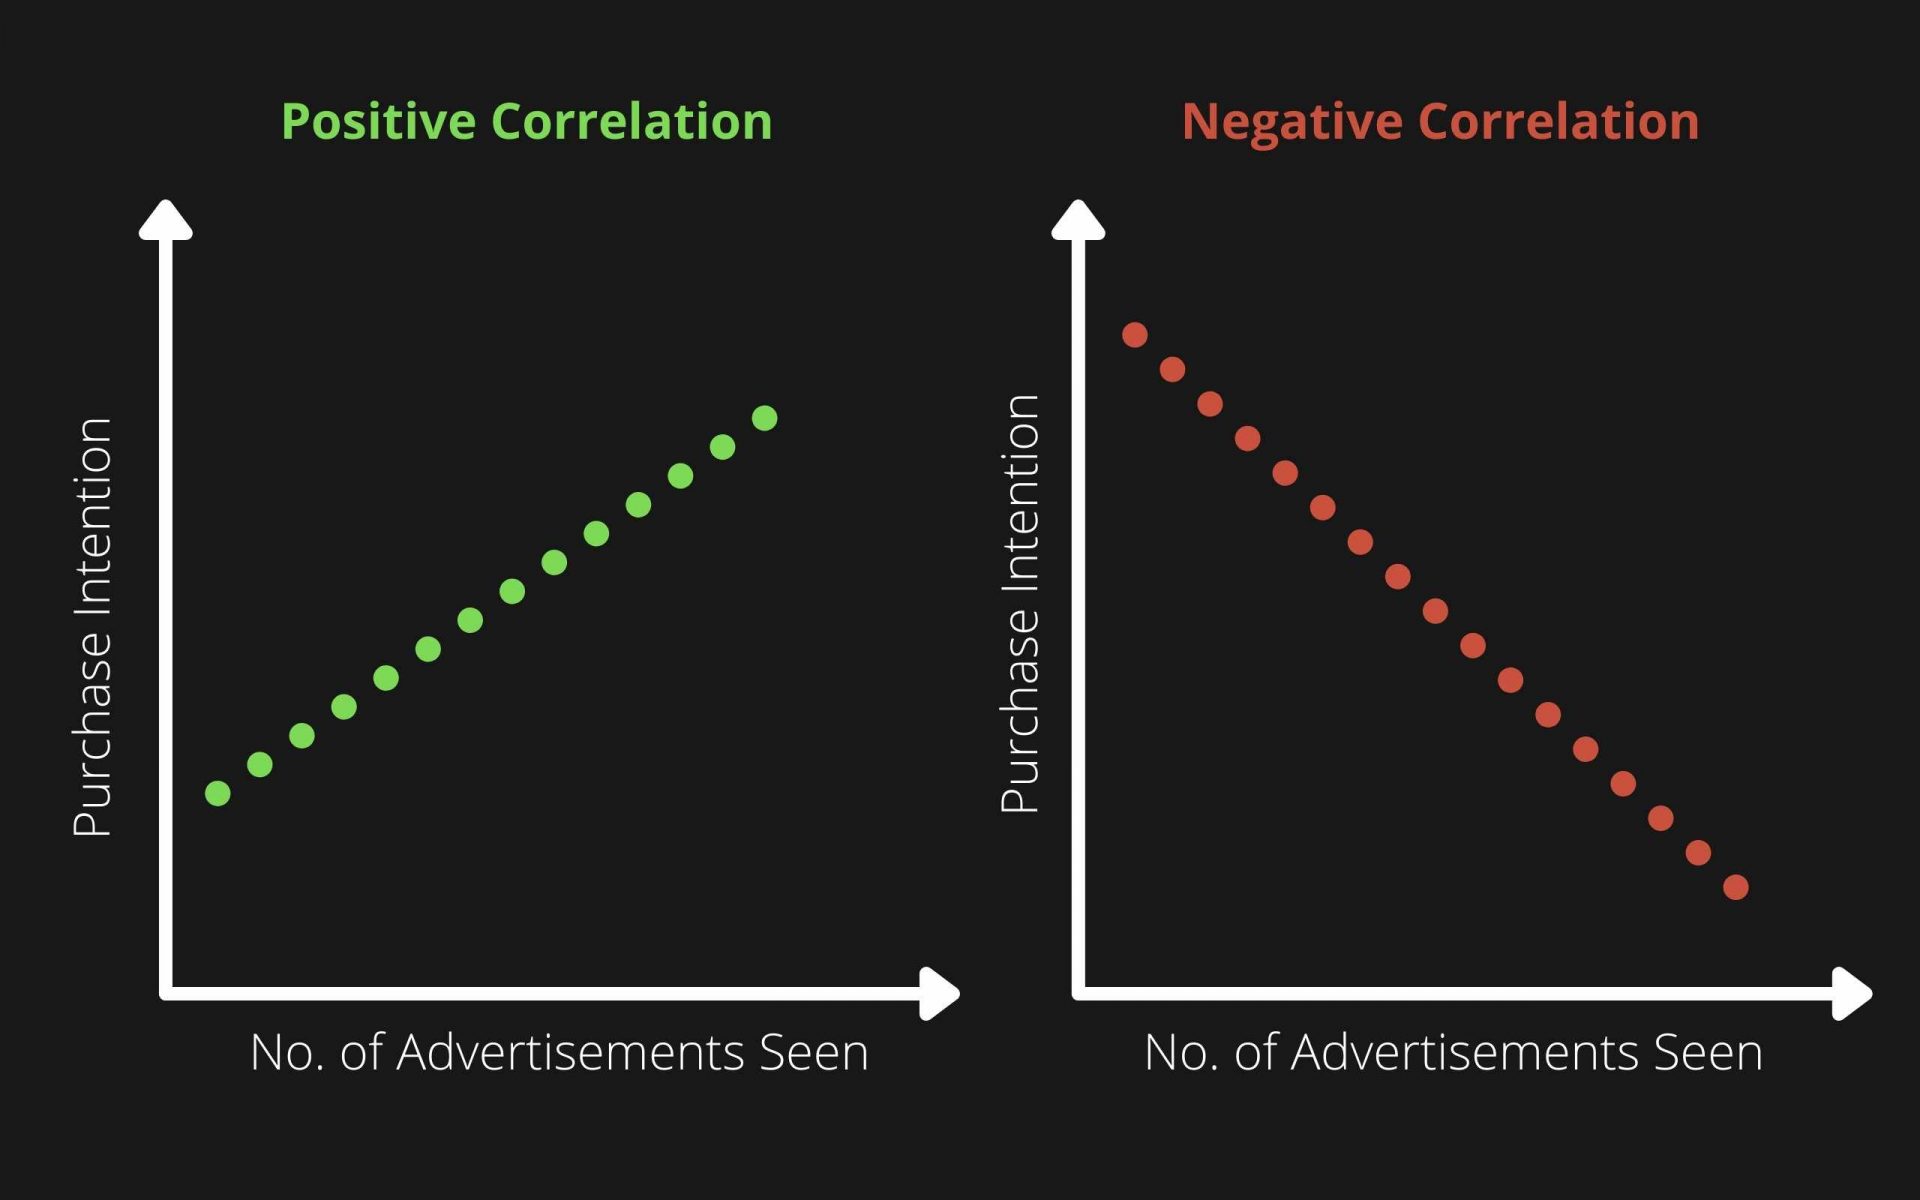
3.Heatmap visualization of the above table. Data Visualization can help express what a thousand words may not be able to. A heatmap helps identify which pairs of columns have the most positive, negative or neutral correlation values. Making it easier for Organizers & Exhibitors to analyze the underlying patterns & KPI signals. 


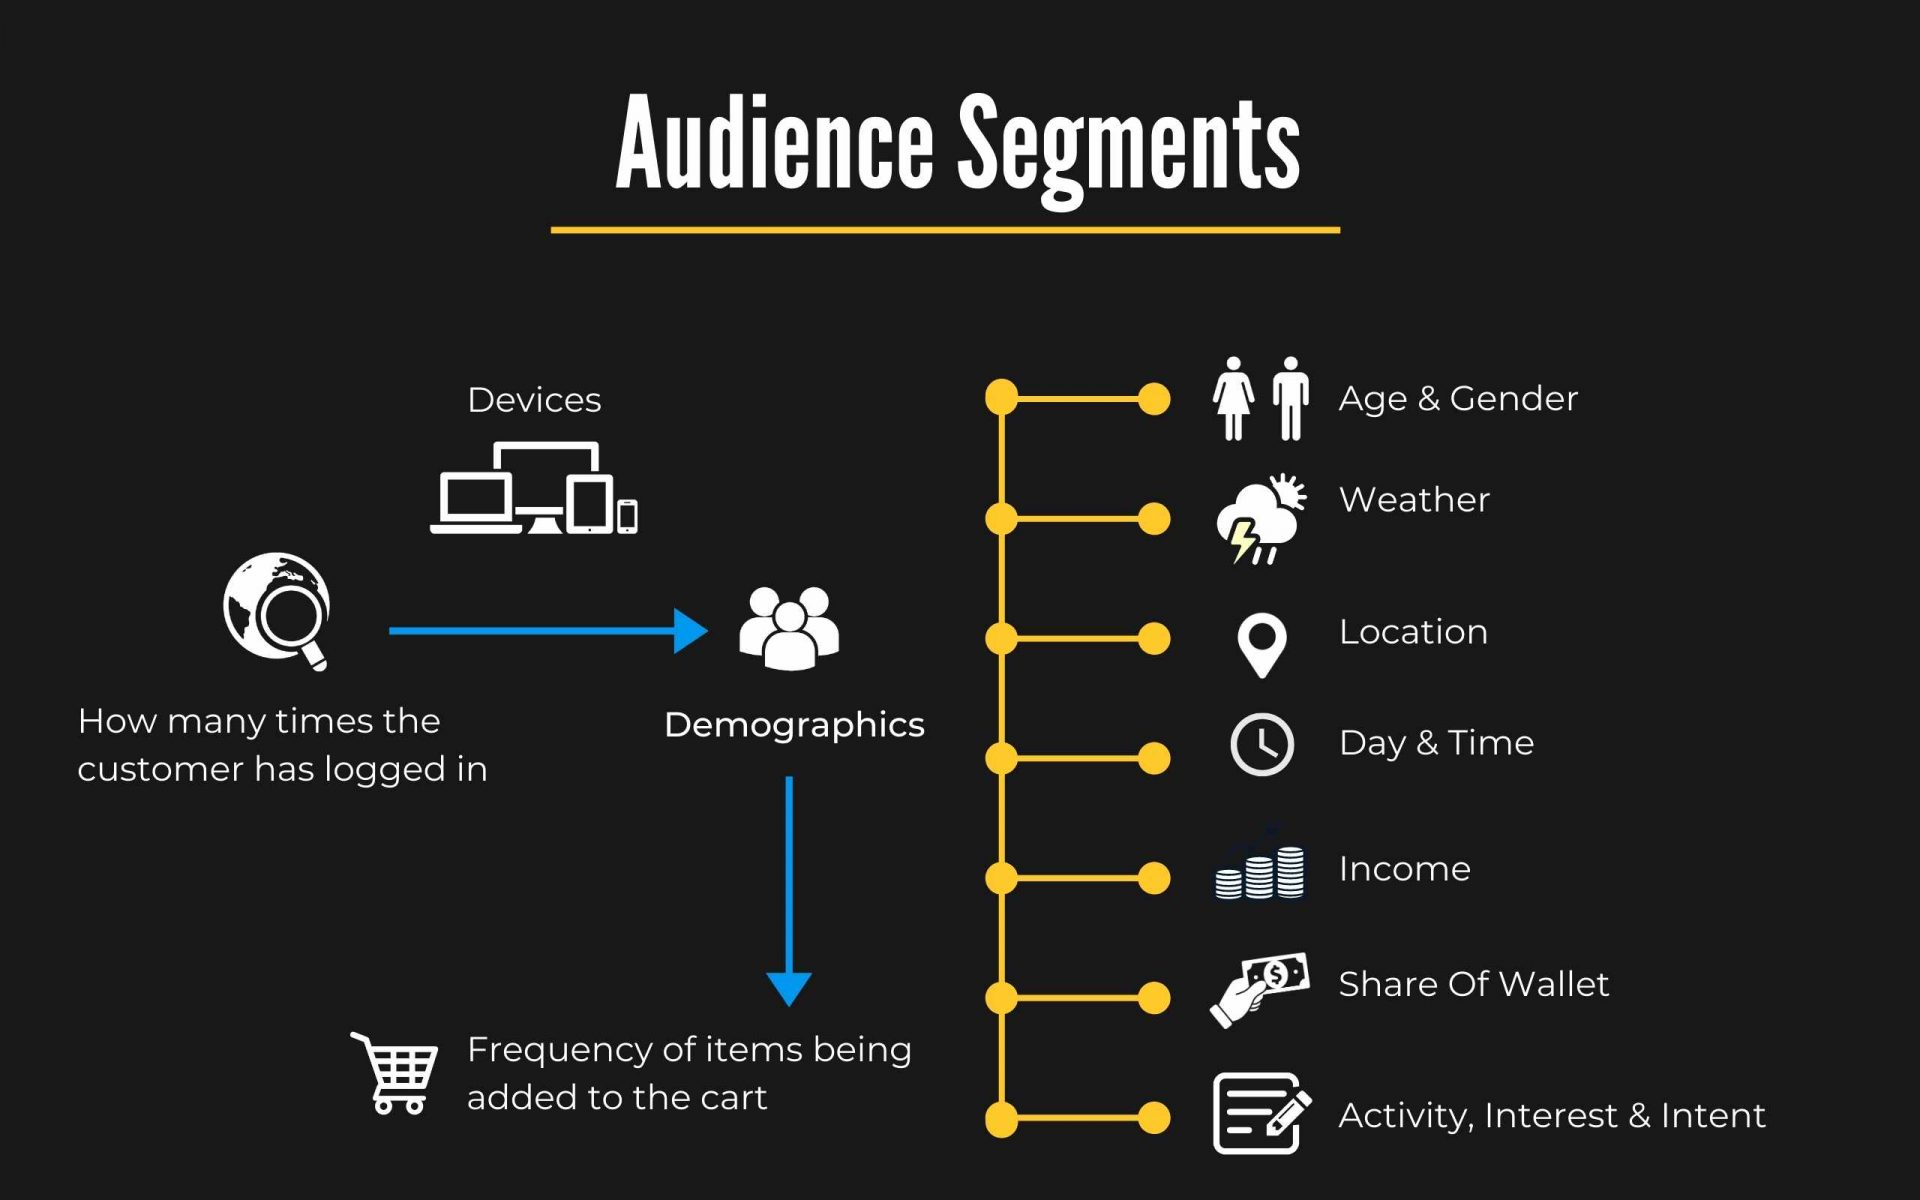
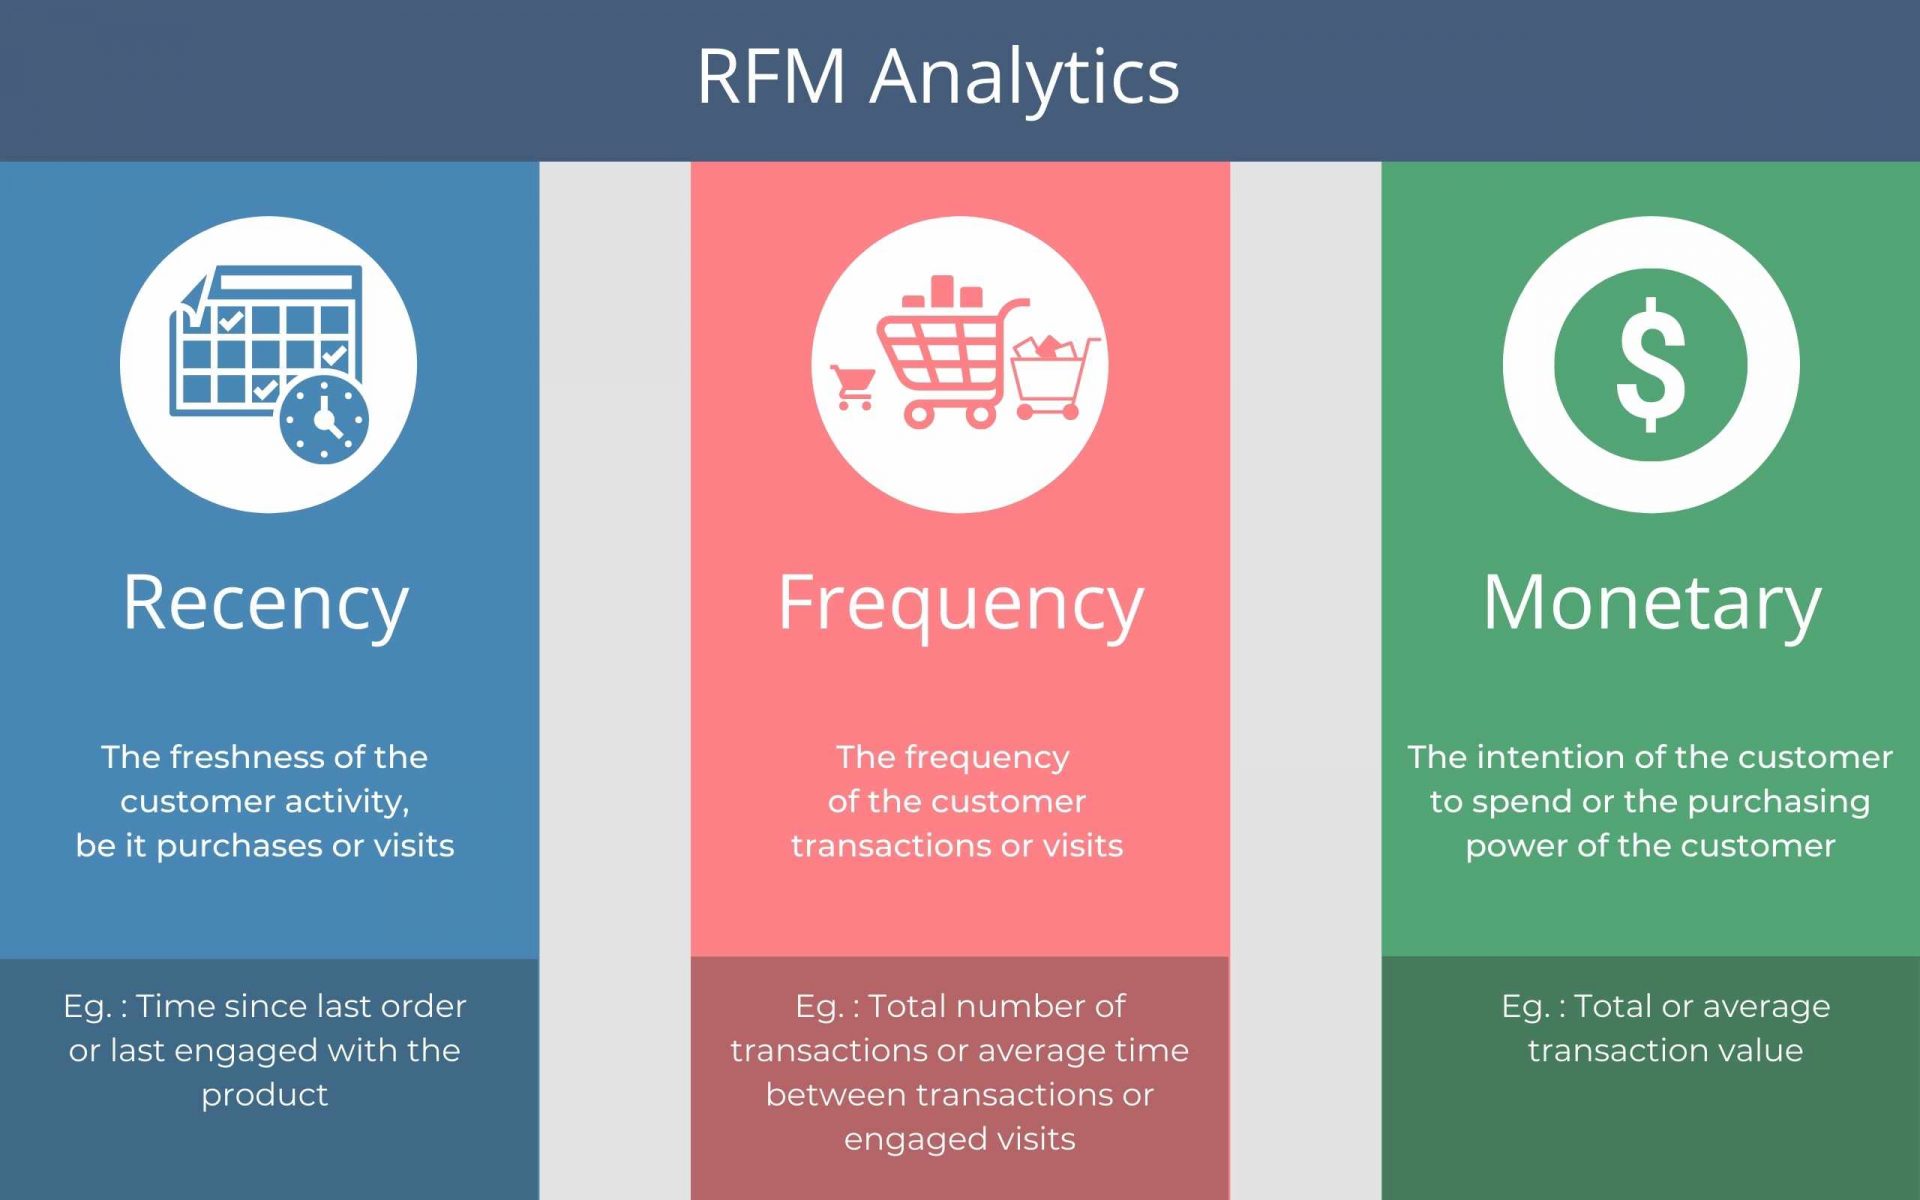
Babel further provides the Customer Segmentation module which leverages on the RFM algorithm. This advanced Segmentation approach enables Exhibitors & Organizers with a customized selection of audiences. 

RFM stands for Recency, Frequency and Monetary Value. It’s a strong contender when it comes to segmenting customers for targeted marketing. The method is simple and does not need scientific acumen to proceed with.

Recency means how recently a customer has interacted with the service provider. It may be for a purchase or surfing the provider’s website or mobile app. Frequency refers to how often a customer interacts with the service provider. Monetary implies the cost of the purchase. This indirectly relates to the financial worth of the customer to the business. The more recent or frequent the interaction, the more likely that the customer will be interested in the potential offerings of your business.

Users of this module must provide 3 key fields in the data set to leverage the Customer Segmentation module –  

1.The Event Attendee ID  

2.Date of Purchase for the Event (tickets, etc)  

3.Amount spent on the Purchase 

  • This module groups the transactions according to the Attendee ID and works on all the three RFM parameters. The output of the module is a CSV file which indicates the final RFM category and associated RFM scores for each Event Attendee ID. This helps Organizers & Exhibitors to more specifically target audience segments. 

Hope this blog has aroused your interest in the benefits that platforms like ISDA AI bring for the Events industry. Reach out to us to know how your firm too can improve Event Attendee Experience, Engagement & Conversions! 

×